
📊 Full opportunity report: Building an AI Trading Bot — Week One: Why a 90 % Win Rate Can Still Lose Money on ThorstenMeyerAI.com — validation score, market gap, and execution plan.
TL;DR
An experimental AI trading bot with over 90% win rates on paper trades does not necessarily generate profits. High win rates can be misleading without considering market context and risk profile.
Week one of a research project involving an AI-driven trading bot has demonstrated that strategies with over 90% win rates on paper trades do not inherently produce profits. The experiment, conducted in a simulated environment, highlights that high win rates can be misleading without accounting for market-implied probabilities and risk-reward dynamics. This finding underscores the complexity of developing consistently profitable trading algorithms.
The researcher has been testing 21 different strategy variants across multiple crypto assets using simulated trades. Several strategies initially appeared highly successful, with some showing near-perfect win rates over dozens of trades. However, further analysis revealed that these strategies mainly capitalized on trades already heavily favored by market prices, which skews the interpretation of their true edge.
When adjusting for the market’s implied probability—meaning the actual likelihood already priced into the asset—the apparent high success rates diminished significantly. For example, strategies that seemed to have a 98% or 100% win rate on paper actually performed close to the market-implied 95% probability, which does not translate into a profitable edge after accounting for transaction costs and risk. Conversely, one strategy with a below-50% win rate showed a positive net profit because its larger wins outweighed its smaller number of losses, consistent with a genuine predictive edge.
Furthermore, the same strategy applied to different assets produced inconsistent results: it was profitable on one but showed significant losses on others, indicating that market microstructure and volatility regimes heavily influence strategy performance. The researcher emphasizes that these early findings are preliminary and that more data is needed before confirming any strategy’s durability or real edge.
Week one.
Why a 90% win rate
can still lose money.
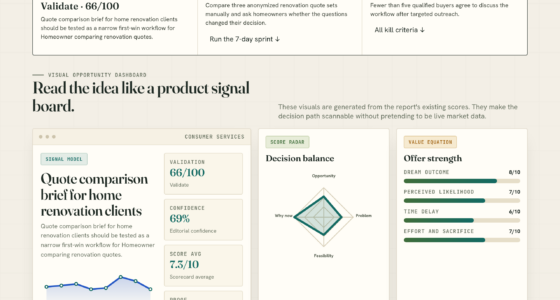
21 strategies running in parallel · 700+ settled paper trades · 18 of 21 with reasonable win rates · 2 variants at 100% wins. And almost none of it means what it looks like.
An experimental AI-driven trading bot running 21 strategy variants against 5-minute binary prediction markets on major crypto assets. Every trade is paper — simulated funds only. Headline numbers look extraordinary: 18 of 21 variants with reasonable win rates · entire fleet on one underlying with >90% wins · two specific variants at 100% wins over 38-44 settled trades. The data is telling a very different story than the leaderboard suggests. Most of the "winning" strategies are buying when the market has already priced one side at 90-95 cents on the dollar — the right baseline isn't 50%, it's the market-implied probability, and below 95% wins on that math is a slow bleed. One strategy — and only one — has the opposite signature: below-50% win rate, 2.5× average winning trade vs losing trade, meaningfully positive net P&L over several hundred settled positions. The right signature. The smoking-gun negative result: same code running on different assets is statistically significantly losing money. Same model, same parameters, different markets, different results — that's data you'd pay for.
90% wins. Still net negative.
Most of the "winning" strategies in the fleet are buying when the market has already decided one side is going to win. They wait until one outcome is priced around 90-95 cents on the dollar, then take the favorite. If the favorite holds, the trade pays a few cents. If it doesn't, the trade loses almost the entire bet. The asymmetry makes the high win rate structurally meaningless.
One candidate. Right signature.
After dismissing the high-win-rate experiments as mechanical illusions, the search shifted to the opposite signature — a strategy that loses more often than it wins but still makes money. That's the mathematical fingerprint of a real prediction signal: bigger wins than losses, willing to be wrong frequently in service of being right with conviction.
Same code. Different markets.
The strongest evidence that the candidate strategy might be real comes from an unexpected place: running the exact same code on different assets produces statistically significant losses. Same model, same parameters, same code path, different volatility regime, different microstructure, different result.
Five lessons. Plain language.
What week one actually taught. The lessons are not novel to anyone who has spent serious time on systematic trading — but you don't internalize them until you watch them happen on your own paper bankroll. Out of 21 variants, one candidate worth more investigation. The ratio is roughly what was expected going in.
Win rate lies. Sample sizes lie. Most things that look like alpha are not. A high win rate, by itself, tells you almost nothing about whether a strategy has edge — it tells you about the kind of trades being taken, not the quality of the decisions. One strategy in the fleet has the right signature — <50% wins, 2.5× win:loss, meaningfully positive net P&L on the most liquid underlying. That's the candidate worth watching. Same code on different markets produces statistically significant losses — informative in a way "everything's green" never is. If you take this article as a reason to put money into anything, you have misread it.
Implications of High Win Rates in AI Trading
This research demonstrates that a high win rate alone is not a reliable indicator of a trading strategy's profitability or genuine predictive power. Traders and developers should focus on the risk-reward profile and whether the strategy can generate profits after considering market-implied probabilities and transaction costs. The findings caution against overinterpreting early success metrics and highlight the importance of understanding the underlying market dynamics.

Algorithmic Trading and DMA: An introduction to direct access trading strategies
- Condition: Used Book in Good Condition
As an affiliate, we earn on qualifying purchases.
As an affiliate, we earn on qualifying purchases.
Previous Misconceptions About Win Rates in Trading Algorithms
Historically, many traders and algorithm developers have equated high win rates with successful strategies. However, financial theory and empirical evidence suggest that profitability depends more on the size of wins relative to losses and the timing of trades rather than win frequency alone. This experiment aligns with prior research indicating that strategies with frequent small wins can be unprofitable if they do not outperform the market's embedded probabilities.
The experiment's design, using simulated trades with real market data, aims to isolate the effect of strategy logic from market noise, providing clearer insights into what constitutes an edge. The initial results reinforce the notion that successful trading strategies must account for market structure and risk management, not just win rate metrics.
"A high win rate, by itself, tells you almost nothing about whether a strategy has an edge. It’s about the size of wins versus losses and whether those wins are truly exploiting market inefficiencies."
— Thorsten Meyer, lead researcher

Use Claude to Build 7 AI Trading Bots: Stocks, Options, Crypto. The Multi-Strategy Playbook used for Backtesting and Live Trading (AI Trading Bot Series)
As an affiliate, we earn on qualifying purchases.
As an affiliate, we earn on qualifying purchases.
Uncertainties About Strategy Durability and Real-World Performance
It remains unclear whether any of the tested strategies will maintain their performance over a larger sample size or under real trading conditions. The experiment is still in early stages, and factors such as transaction costs, slippage, and changing market regimes could significantly impact results. Additionally, the specific models and features used are not yet fully disclosed, and their robustness across different market environments is untested.

How to Use AI for Stock Trading: Master the Secret Strategies of AI in Stock Trading: Discover Hidden Tools, Advanced Techniques, and Proven Methods ... Markets and Boost Your Trading Success!
As an affiliate, we earn on qualifying purchases.
As an affiliate, we earn on qualifying purchases.
Next Steps in Testing and Validating AI Trading Strategies
The researcher plans to extend the testing period to gather more data across various market conditions. Further analysis will focus on strategies that demonstrate positive risk-adjusted returns despite lower win rates. The goal is to identify models with genuine predictive edge that can withstand larger sample sizes and real trading environments. Results from these extended tests will be shared in future updates, but the detailed methodology will remain proprietary to prevent replication.

Hotel Market Analysis and Valuation International Issues and Software Applications
As an affiliate, we earn on qualifying purchases.
As an affiliate, we earn on qualifying purchases.
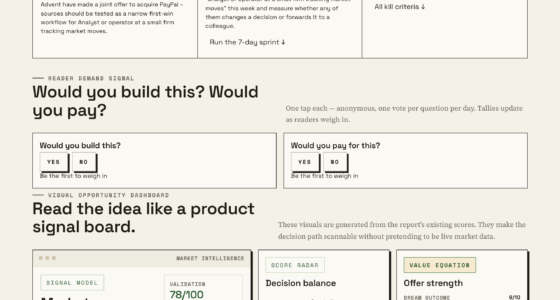
Key Questions
Why does a high win rate not guarantee profits?
Because high win rates often result from taking trades that are already heavily favored by the market, which does not necessarily translate into an edge. Profitable strategies depend more on the size of wins relative to losses and whether they exploit market inefficiencies.
What does market-implied probability mean?
It refers to the likelihood of an outcome already priced into the market, such as the odds implied by current prices or odds in prediction markets. Adjusting for this probability helps determine if a strategy truly has an edge beyond what is already expected.
Can a strategy with a below-50% win rate be profitable?
Yes, if its average wins are significantly larger than its losses and it exploits asymmetric risk-reward opportunities, as seen with some of the strategies in this experiment.
How reliable are these early results?
The results are preliminary, based on a few hundred trades, and may not hold in larger samples or live trading. Further testing is needed to confirm whether any strategy has a sustainable edge.
Will the researcher share the specific models used?
No, the researcher intends to keep the detailed models proprietary to prevent replication and protect any potential edge from being exploited by others.
Source: ThorstenMeyerAI.com