
📊 Full opportunity report: The Stanford AI Index 2026 Audit: Reading the Field’s Annual Report Card With a Critic’s Pen on ThorstenMeyerAI.com — validation score, market gap, and execution plan.
TL;DR
The Stanford AI Index 2026 has been critically audited, highlighting its strengths in benchmarking and transparency but also its limitations in interpretive claims. Readers should treat the data as a curated snapshot, not an unmediated truth.
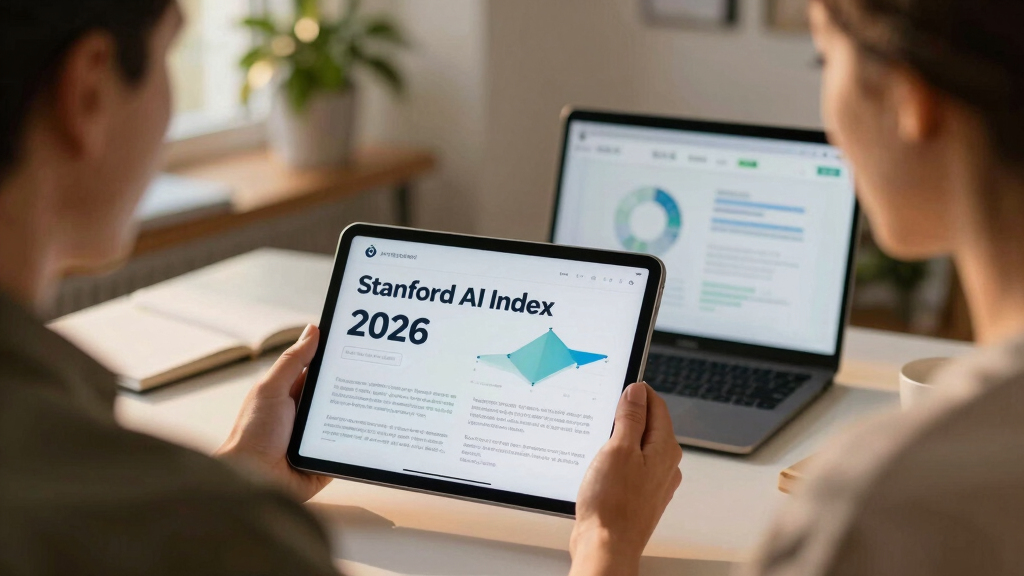
The Stanford AI Index 2026 was published three weeks ago, offering a comprehensive report on AI research, performance, and policy. This audit evaluates its strengths, limitations, and how to interpret its findings critically, emphasizing that the Index is a curated snapshot rather than an unmediated reflection of the AI field.
The 2026 edition of the Stanford AI Index is a 400-page document that covers research, technical performance, economy, responsible AI, science, medicine, education, policy, and public opinion. It is the most-cited annual report on AI, influencing policymakers, industry leaders, and academics worldwide.
The Index’s methodology is rigorous in areas like benchmark performance tracking, policy activity counts, and transparency assessments. For example, it aggregates data from approximately 30 standardized benchmarks, such as the Humanity’s Last Exam progression, GPQA scores, and OSWorld trajectories, with traceable citations. Its Foundation Model Transparency Index, which scores labs on transparency, dropped from 58 to 40 year-over-year, indicating increased industry opacity.
However, the Index is less rigorous in interpretive areas like consumer value, workforce impact, and public sentiment. Its claims about AI’s economic value, workforce displacement, and public opinion are based on surveys and estimates that carry significant uncertainty. The Index itself acknowledges these limitations, urging readers to focus on counted facts and approach interpretive claims with skepticism.
Reading the report card with a critic’s pen.
The Index is rigorous on what it counts and interpretive on what it summarizes. Both descriptions are accurate.
The Stanford AI Index 2026 is the most cited annual document on AI. 400+ pages, 9th edition, 11 chapters. The Foundation Model Transparency Index dropped 58 → 40 in one year. The Index can only measure what gets disclosed. The audit identifies where to anchor on counted facts, where to discount the interpretive claims, and how to read the document with appropriate skepticism.
Where the Index is rigorous. Where the Index is interpretive.
The Index is most rigorous on what it counts (publications, models, dollars, policies, benchmark scores). It is least rigorous on what it interprets (consumer value, workforce impact, public sentiment). Anchor on counted facts. Treat interpretive claims with proportionate skepticism.
Benchmarks saturate faster than they’re constructed.
The Index reports benchmarks at the moment of saturation — by which time the benchmark has lost most of its discriminating power. The benchmarks the 2026 Index reports are running out of useful signal even as they are being published. The 2027 Index will need new benchmarks the 2026 frontier doesn’t saturate.
Five reliable. Five fragile.
Specific numbers from the 2026 Index that should be quoted directly versus quoted only with explicit confidence intervals. The same Index produces both kinds of finding. Distinguishing them is the audit’s central practical contribution.
- FMTI 58→40 YoYIndex’s own measurement of explicit construct. Documented methodology. Trend unambiguous.
- Arena Elo top tierAnthropic 1503, xAI 1495, Google 1494, OpenAI 1481. Standardized methodology. Quote directly.
- Closed-vs-open gap 3.3%Up from 0.5% in Aug 2024. Precise measurement of structural shift. Open-vs-closed inflection.
- Robots 12% household tasksMost underappreciated number in entire Index. Concrete physical-world gap.
- Apollo Go 11M rides +175% YoYPublic-record disclosure. Clean methodology. Chinese AV scale underreported.
- $172B “consumer value”Willingness-to-pay survey data. Real CI: ~$50–300B. Quote trend, not level.
- 53% global adoption in 3 yearsIncludes any-use-ever. Sustained use ~20–30%. Clarify the definition.
- Median value tripled ’25-’26Same WTP methodology. Probably 1.5–4×. Direction reliable, magnitude not.
- US ranks 24th at 28.3%Trial-vs-sustained sensitivity. Rank > absolute %.
- “Hits young workers first”Multiple alternative explanations. Treat as correlation, not causation.
The Index’s authority creates the obligation to audit it. The audit produces a more useful document, not a less useful one.
Four assignments. By role.
Read the methodology appendix first.
Even if you cited prior editions, the 2026 has more rigor on some numbers and more interpretive freedom on others. Quote rigorous numbers directly. Caveat interpretive numbers. Acknowledge the Index’s own self-criticism in your citation. Stanford HAI’s authority comes partly from its self-criticism — preserving that in citation chains preserves the authority.
Use the FMTI drop as institutional pressure.
The 58 → 40 transparency drop is the field’s primary authoritative scoreboard saying you disclose less than you used to. Visibility in the Index — and the framing capture that comes with it — depends on willingness to disclose. Labs that publish more methodology capture more positive framing. Labs that publish less become invisible to the document that policymakers read.
Calibrate use to category gradations.
Policy chapter is most rigorous and most directly actionable. Public-opinion chapter most subject to framing effects. FMTI is the single most important methodological signal. Do not quote consumer-value dollar figure as a fact; quote the trend instead. Read policy + transparency carefully. Read public-opinion with skepticism.
Use the Index as starting point, not citation chain endpoint.
Read the methodology appendix before any chapter. The science and medicine chapter framings are unusually critical and worth integrating into your own work. Treat “notable models” geographic distribution as curated rather than complete picture. Underlying source surveys and labor-market studies are the real citation chain.
Limitations of the Index’s Interpretive Claims
The Index’s rigorous benchmarking and transparency assessments provide valuable data points for understanding AI progress. However, its interpretive claims about AI’s impact on society, economy, and policy are less certain. This matters because policymakers and industry leaders rely heavily on the Index’s conclusions, which may overstate or understate certain trends. Recognizing these limitations is crucial for informed decision-making and avoiding overconfidence in current AI capabilities.
Evals for AI Engineers: Systematically Measuring and Improving AI Applications
As an affiliate, we earn on qualifying purchases.
As an affiliate, we earn on qualifying purchases.
Background and Development of the Stanford AI Index
The Stanford AI Index has been published annually since 2017, aiming to synthesize diverse data sources into a comprehensive overview of AI progress. The 2026 edition is its ninth, reflecting rapid advancements in AI models, increased investment, and expanding policy activity worldwide. Its methodology combines benchmark scores, scientific publication metrics, policy counts, and surveys, with an explicit acknowledgment of the jagged and uneven nature of AI development. The Index’s steering committee includes both academic and industry representatives, balancing objectivity and practical insights.
“The Index’s strength lies in its rigorous benchmarking, but its interpretive claims require careful reading and skepticism.”
— Thorsten Meyer, author of the report

Talia Midsize Size Disc and Covers Set 22 – Luxe 2 Sky w/wht, Deep Lake Blue w/clr, Clear w/ET, Arctic Ice w/AI, Blue Floral w/DLB
As an affiliate, we earn on qualifying purchases.
As an affiliate, we earn on qualifying purchases.
Uncertainties in AI Impact and Future Developments
While the Index provides reliable data on benchmarks and policy activity, it offers limited clarity on AI’s societal and economic impacts. Its estimates of workforce displacement, consumer value, and public sentiment are based on indirect measures with high variability. The rapidly evolving nature of AI models and the lack of standardized impact metrics mean these interpretive areas remain uncertain. It is also not yet clear how the Index will adapt to new AI developments or methodological innovations in the coming years.

The Practical Guide to Research Methodology: Clarity, Quality, and Responsible Use of AI for Decision Ready Work
As an affiliate, we earn on qualifying purchases.
As an affiliate, we earn on qualifying purchases.
Next Steps for AI Monitoring and Index Refinement
Following the 2026 publication, the Index team is expected to refine its methodology, especially around interpretive claims. There will likely be increased focus on developing standardized impact metrics for workforce and societal effects. Additionally, the Index may expand its coverage of emerging AI domains and improve transparency about data sources. Stakeholders should continue to critically assess the Index’s findings and supplement them with independent data and analysis.

If Anyone Builds It, Everyone Dies: Why Superhuman AI Would Kill Us All
As an affiliate, we earn on qualifying purchases.
As an affiliate, we earn on qualifying purchases.
Key Questions
How should I interpret the benchmark scores in the Index?
The benchmark scores are rigorously sourced and provide a reliable measure of AI model performance across various tasks. They should be viewed as indicators of technical capability rather than direct reflections of real-world AI deployment or societal impact.
What are the main limitations of the Index’s societal impact claims?
The Index’s societal impact assessments are based on surveys, estimates, and indirect indicators, which carry significant uncertainty. These claims should be read with caution and supplemented with other sources of analysis.
Will the Index influence policy decisions?
Yes, the Index is highly influential among policymakers and industry leaders. However, understanding its methodological limitations is essential for making balanced decisions based on its findings.
How might the Index evolve in future editions?
The Index is expected to improve its impact measurement methods, expand coverage of new AI domains, and increase transparency about data sources to better serve its role as a comprehensive AI progress tracker.
Source: ThorstenMeyerAI.com